
The problem
Planners manually mapped greenhouse placement using Excel, creating a critical bottleneck.
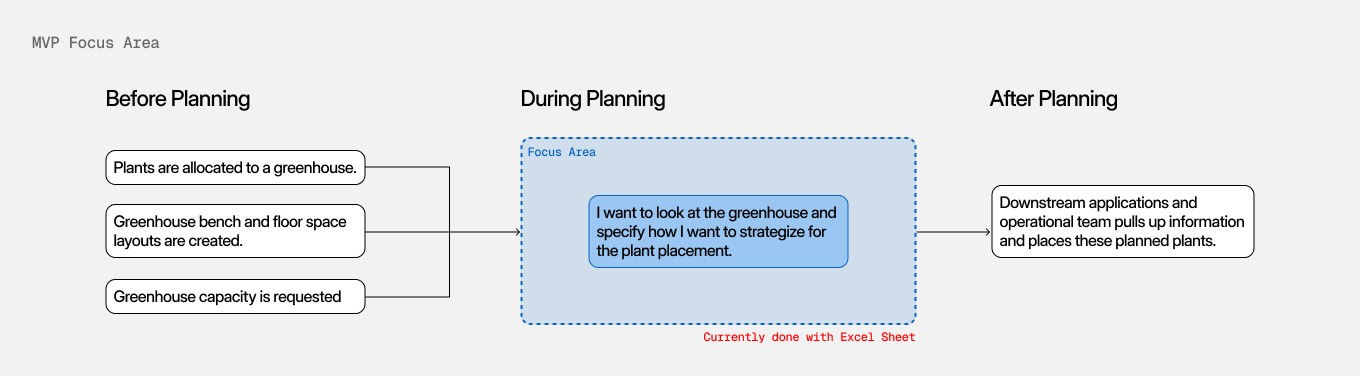
Every day, greenhouse planners mapped 1,000+ plant placements in Excel, then spent hours validating that their plans matched the actual greenhouse floor. As the operations scaled, this process was slow, error-prone, and disconnected from the tools that held the data they needed. We needed a system that brought it all together.
The built solution
Designed a visual grid-based planning experience that replaced Excel and increased operational efficiency.
Instead of spreadsheet rows & columns, planners now visualize their greenhouse spaces as they actually are: through zones, benches, and capacity. They place plants directly on the customizable grid and trust what they see. But this solution didn't come from a brief. It came from understanding how users already think and make decisions.

How it was designed
Understanding what users actually do
I spent time observing planners & statisticians at work and mapped their journey through data gather form 12+ user interviews. They definitely wanted an efficient and flexible way to map plants, but the real problems ran deeper. They thought in zones and benches, not rows and columns

Co-creating with the user's
Bridging the user's mental model and the designed experience.
To understand how users imagined the experience, I ran a Crazy 8 session. This revealed that users wanted an interactive spatial planning experience, but grounded in real data. The grid-based experience needed to balance both: visual enough to match the greenhouse floor, data-rich enough to trust the placement.
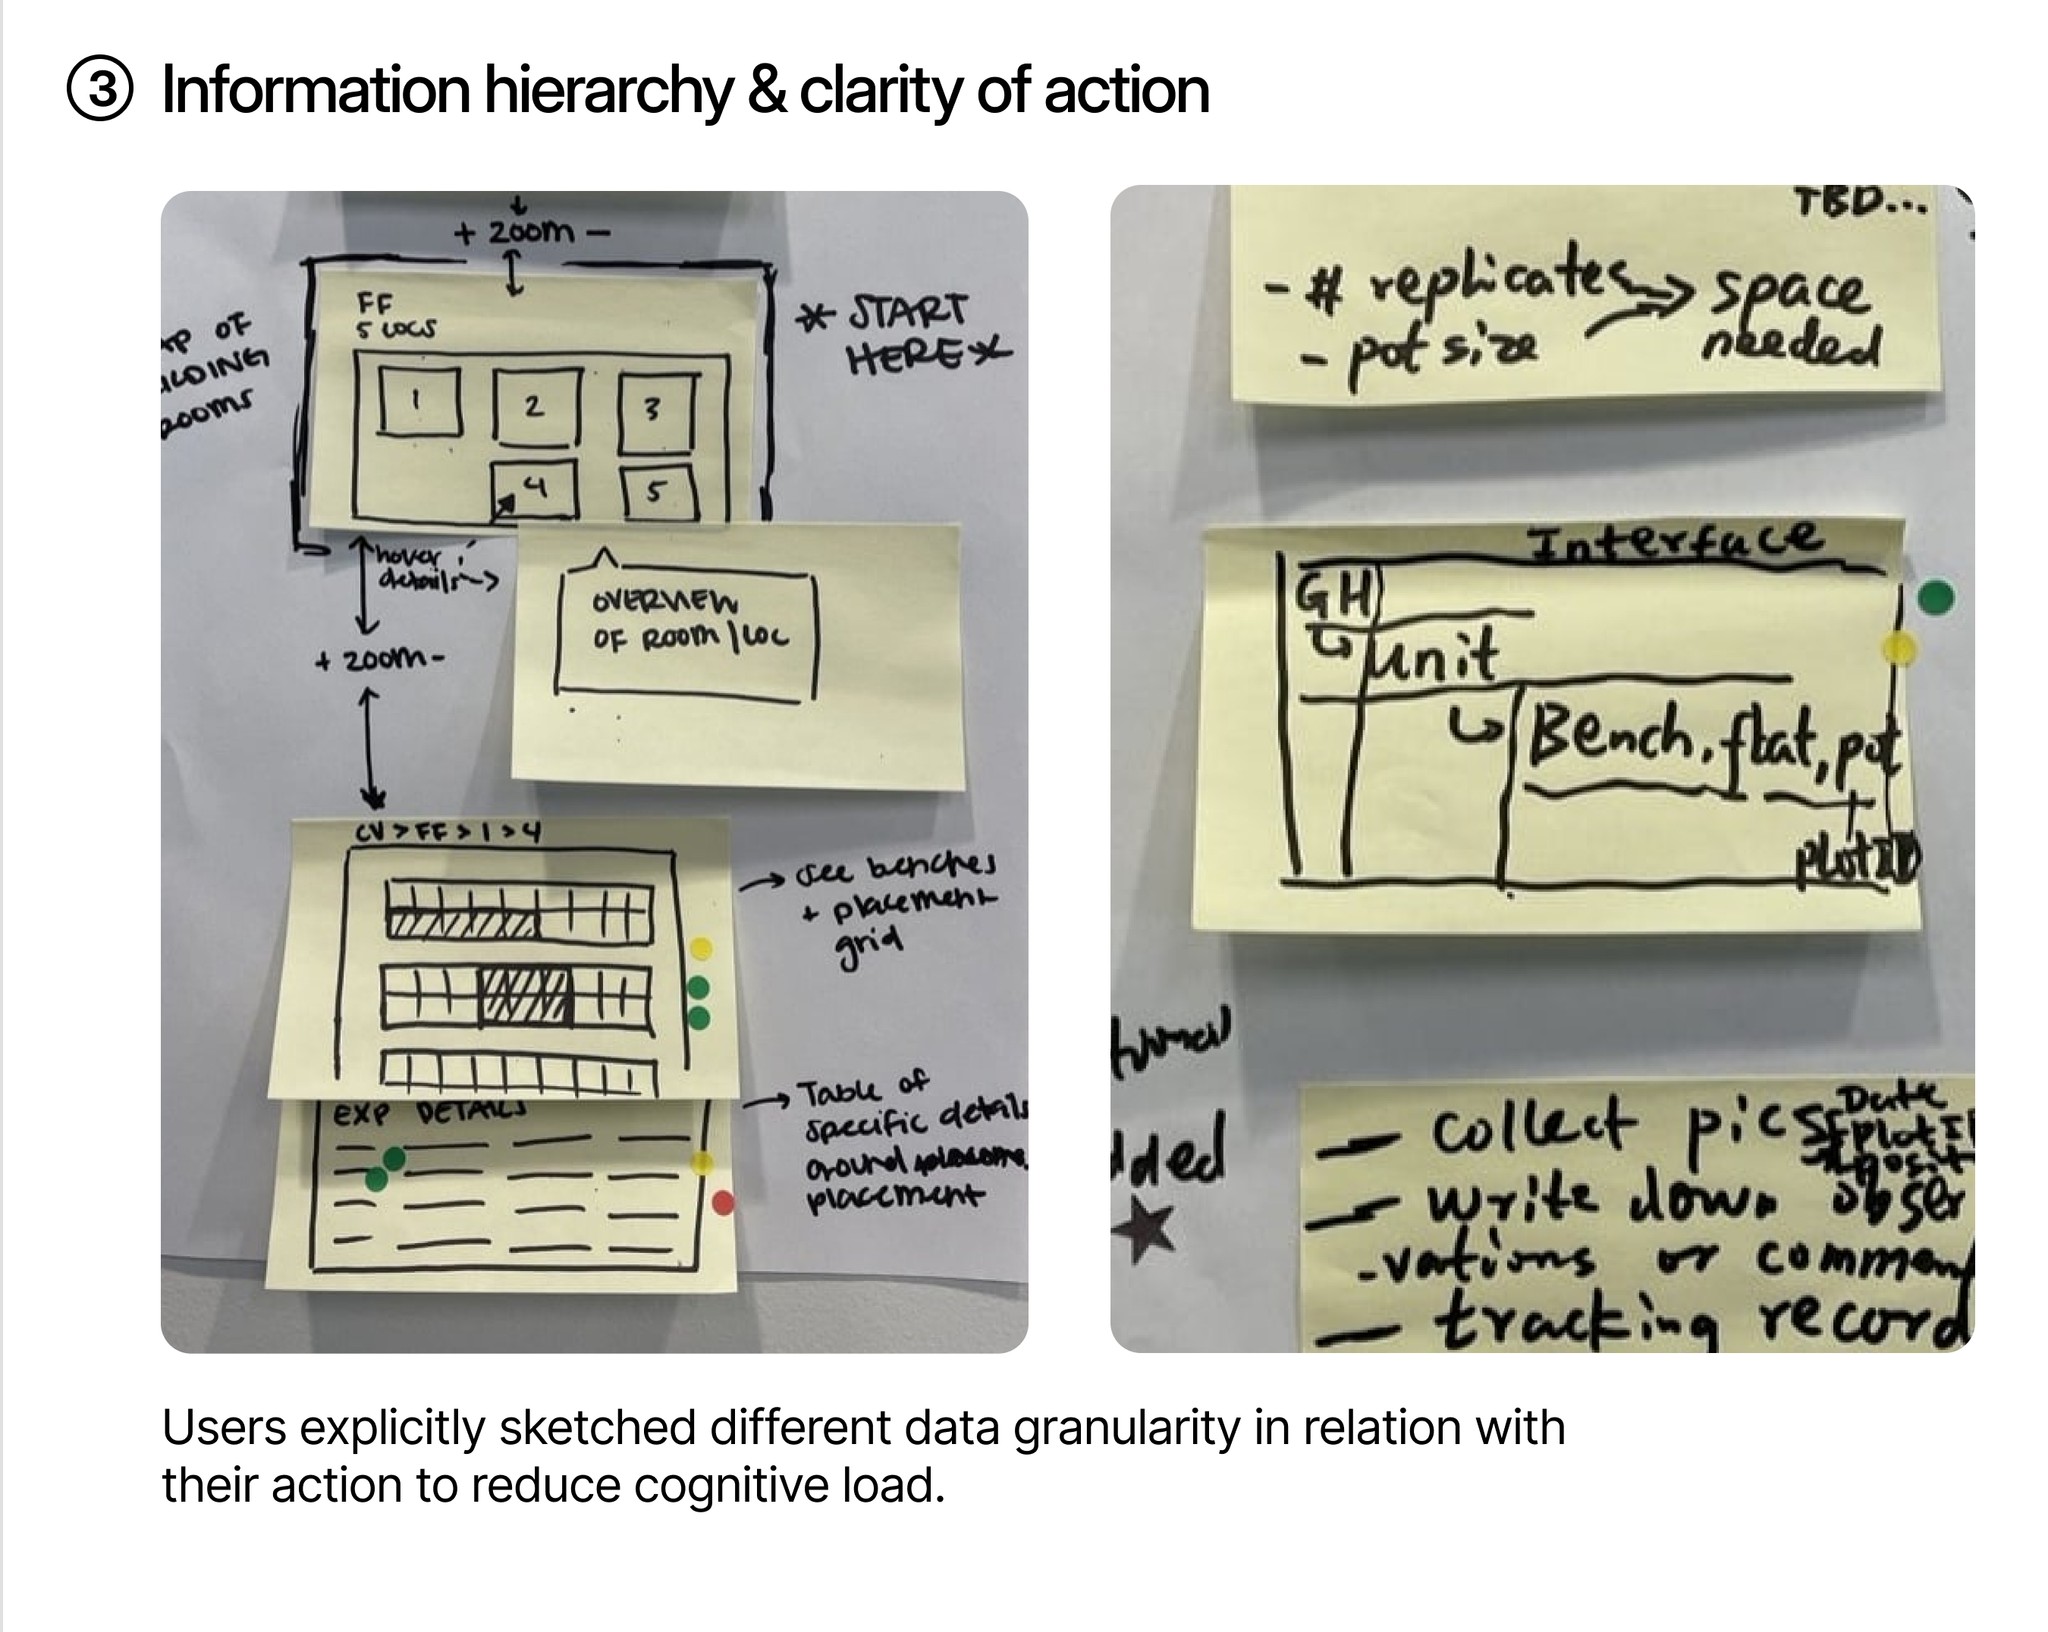
Unexpected signal: Multiple users independently drew progressive disclosure and auto placement interaction, reinforcing that spatial data demands spatial interaction.


Testing and Iteration
Testing revealed where the interaction broke.
The click tests showed users initiating actions from multiple entry points, uncertain about placement orientation, and needing deeper information during editing. We couldn't just add tooltips. We needed to rethink the interaction layer.

Final Designed flow
The Grid became more than a mapping tool; it redefined how teams plan, track, and adapt plant placements across facilities with confidence and flexibility.
What started as an Excel sheet replacement evolved into a visual grid-based planning system, reducing rework, manual verification, and planning time. The system guides toward valid placements while leaving decisions in their hands.

Finding the right greenhouse
Users can easily search across multiple reservations & greenhouse placements in a unified workspace.

Planning layouts that match the greenhouse placements
The grid matches real greenhouse dimensions. What's on screen is what's on the floor, no translation needed.

Placing with confidence
Select plant sets with a layout preference.
System highlights the optimal starting point based on quantity
User clicks starting point → system auto-fills placement OR user manually selects placement preference.

Editing placements without starting over
Drag, move, edit. Changes reflect instantly. User's dont need to rebuild the entire plan when something shifts.
Impact
Successfully transitioned 60% of the users from Excel within the first year of MVP launch.
Users went from manually verifying every result to trusting the system.
Enabled teams to iterate and adjust layouts without restarting or revalidating plans.
Minimized data-entry errors and duplicated efforts, leading to a costly validation process.
Increased users' trust and confidence while planning plant placement.
This project taught me that even in technical, data-heavy environments, design’s role is to create clarity and confidence.
0→1 Products Need Quick Wins
MVP had to deliver immediate value, or users would revert to Excel. We prioritized the one workflow that caused the most pain (initial placement planning) and nailed that before expanding the scope.
Trust is Earned Through Transparency
The auto-suggestion feature only worked because I showed users the WHY behind suggestions. If it had been a black box, they would've ignored it or not trusted it.
Users Don't Always Know What They Need
When I asked users what they wanted, they said "a better Excel sheet." But watching them work revealed they needed a completely different mental model, visual and spatial, not tabular.
Designing this system reaffirmed my belief that meaningful innovation happens when empathy meets complexity and when design helps people see their work in a new light.